The Spreadsheets
Prepare to lock in.
By reading this page from start to finish, one should have a proper understanding of the methodology behind Cheese Bank and how it plans to achieve its goal.
(tip: it’s much easier to visualize and understand on a monitor).
This first spreadsheet serves to orient ourselves for the ones to come, as well as the fundamentals of endowments.
Example - $1.00
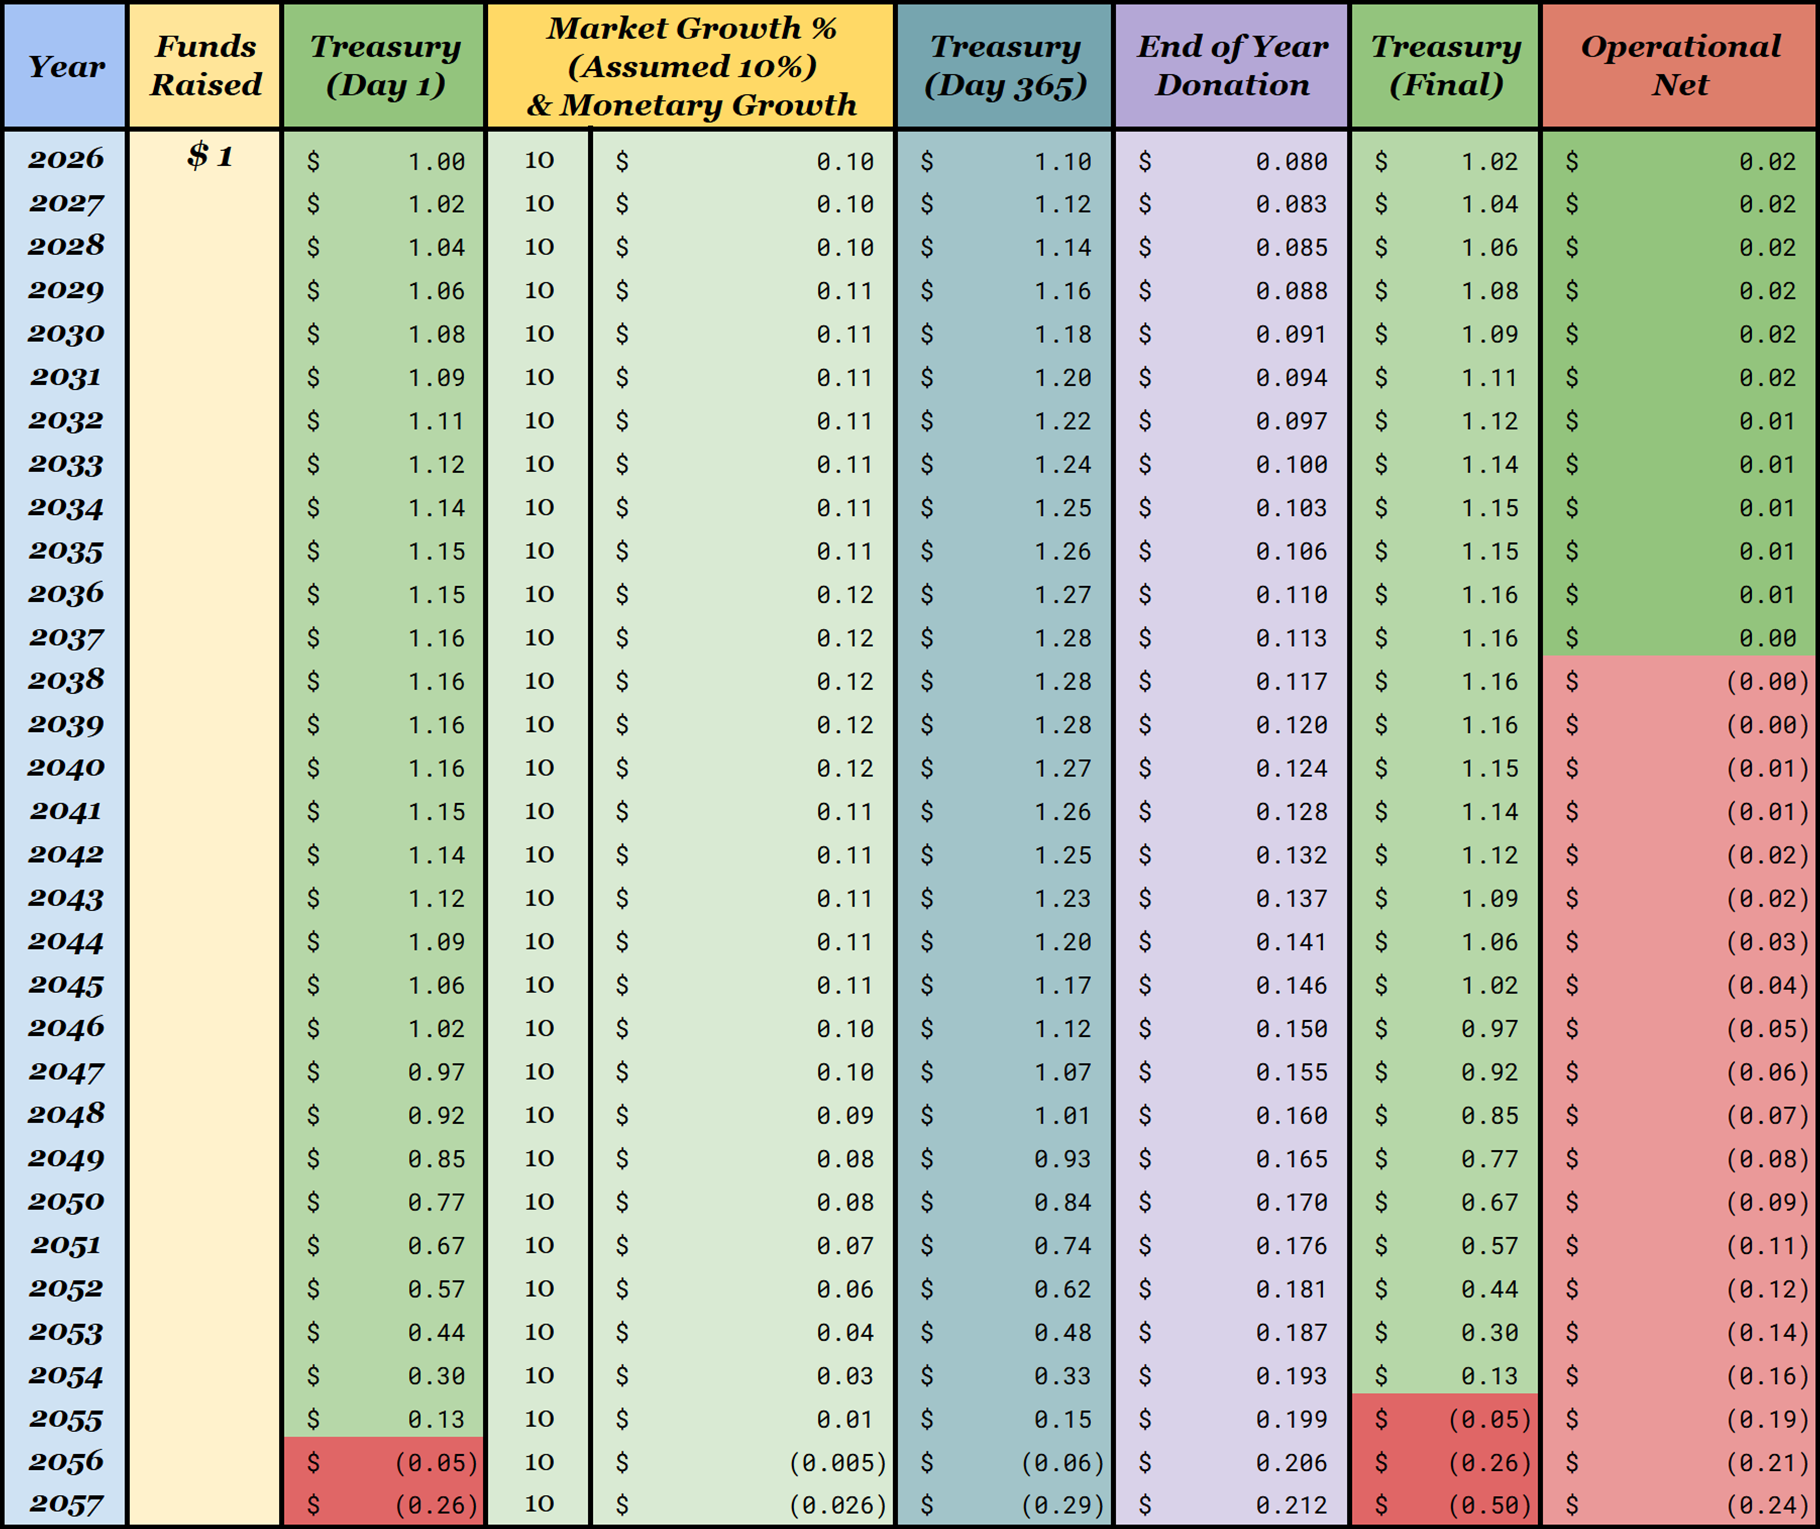
The first two columns tell us what Year we are in and Funds Raised that year, which will play a role down the line. Treasury (Day 1) is the sum of money within Cheese Bank, including funds raised that year and leftovers after donations of the previous year.
For now, we shall assume a Monetary Growth of 10% per year in the stock market [1]. For ease of calculation, we shall assume that we do not donate any money until the last day of the year, making Treasury (Day 365) the growth from Monetary Growth plus Treasury (Day 1).
In our thought experiment, we send all donations out at the final moment of the calendar year, titled End of Year Donation, which when subtracted from Treasury (Day 365) results in Treasury (Final). The value of Treasury (Final) at the end of a year is equal to Treasury (Day 1) of the next year.
Lastly, Operational Net represents if our Monetary Growth is larger than End of Year Donation. If Operational Net is positive (green), Cheese Bank may be on the path to be fully self-sustaining, providing that that growth out paces inflation of treatment costs (an assumed 3.2%).
If Operational Net is negative (red), such that donations are larger than our growth that year, Cheese Bank will eventually run out of funding. Red in any Treasury column indicates a collapse of Cheese Bank, as seen at the bottom of Treasury (Day 1) and Treasury (Final).
In sum, this example sheet shows that initially our principle rises above the starting value due to market growth. However, our operational net was not positive enough to have a sustained increase in the treasury to out pace inflationary rises in treatment costs. In that, Monetary Growth peaked at $0.12 per year until End of Year Donation rose above that value in 2039. From that year and after, donation sizes ate away at the treasury, as growth no longer sustained continuous donations. This scenario demonstrates how treatment costs could outpace growth, which eventually exhausts the treasury and ends Cheese Bank (in the year 2055 for this example).
Example - $2.00
The next example is the exact same scenario, with the only difference being that our starting principle is $2.00.
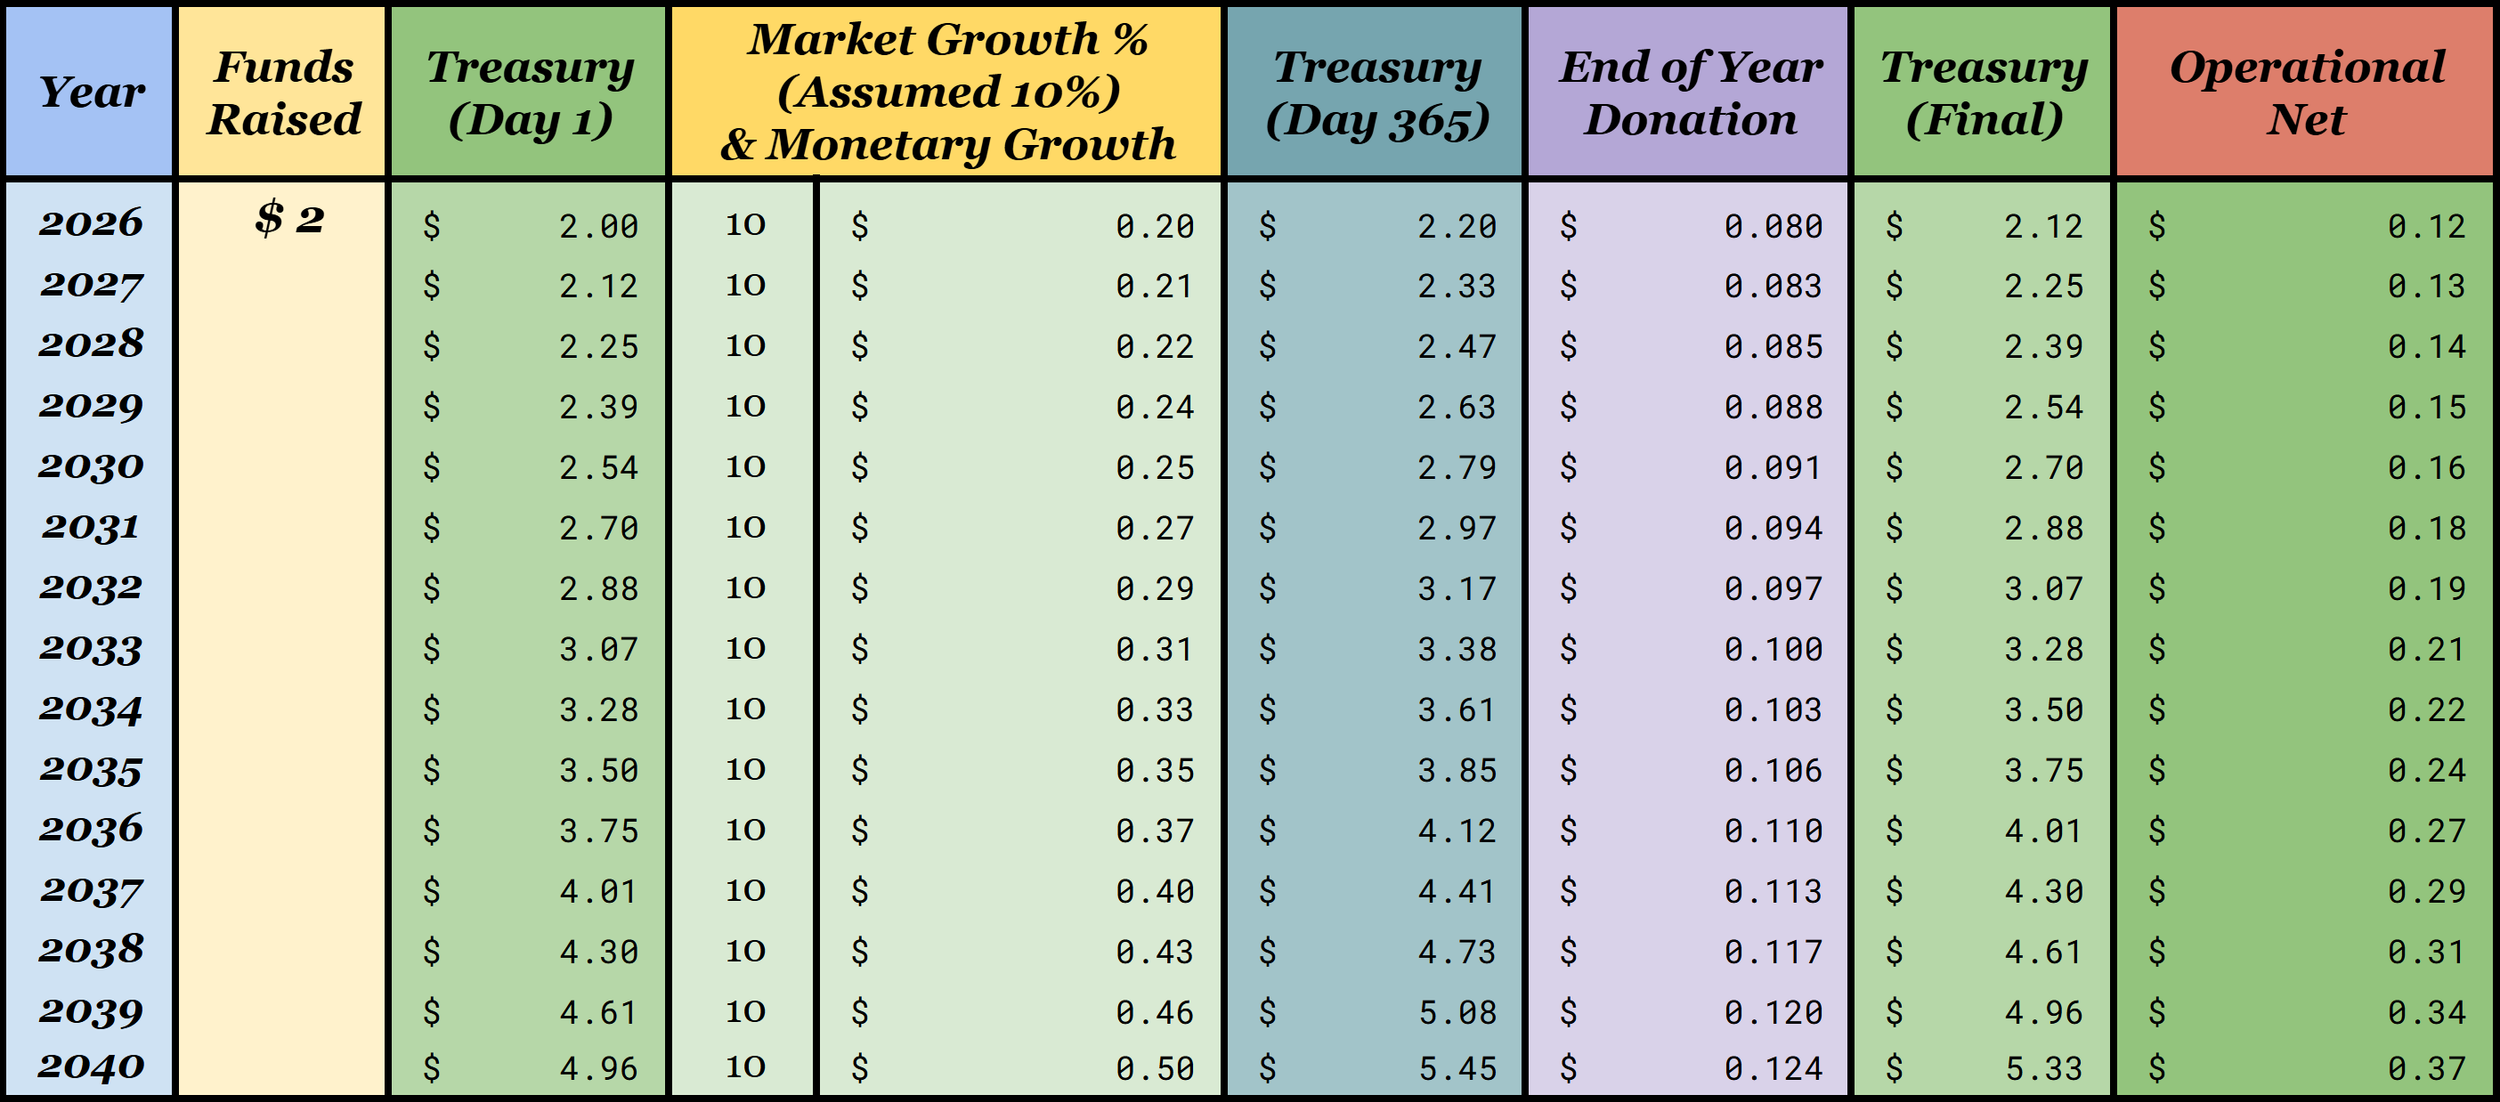
With a growth of $0.20 in 2026 being much larger than the donation of $0.08, we have an operational net of $0.12. Because of that, there is $2.12 in the treasury to grow in 2027. In the second year, growth is $0.21, rather than $0.20, due to the increase in principle in Treasury (Day 1) of 2027. This increase continues year after year, forever having enough in the treasury to donate and continue exponential growth. Fundamentally, Cheese Bank is utilizing the idea of compounding interest, with our goal of growing enough each year that annual donations do not stop our exponential growth. Essentially, turning our starting principal’s annual profits into donations forever. This is the key driving concept behind all endowments, as well as what you should do with your own investments.
An Ideal World
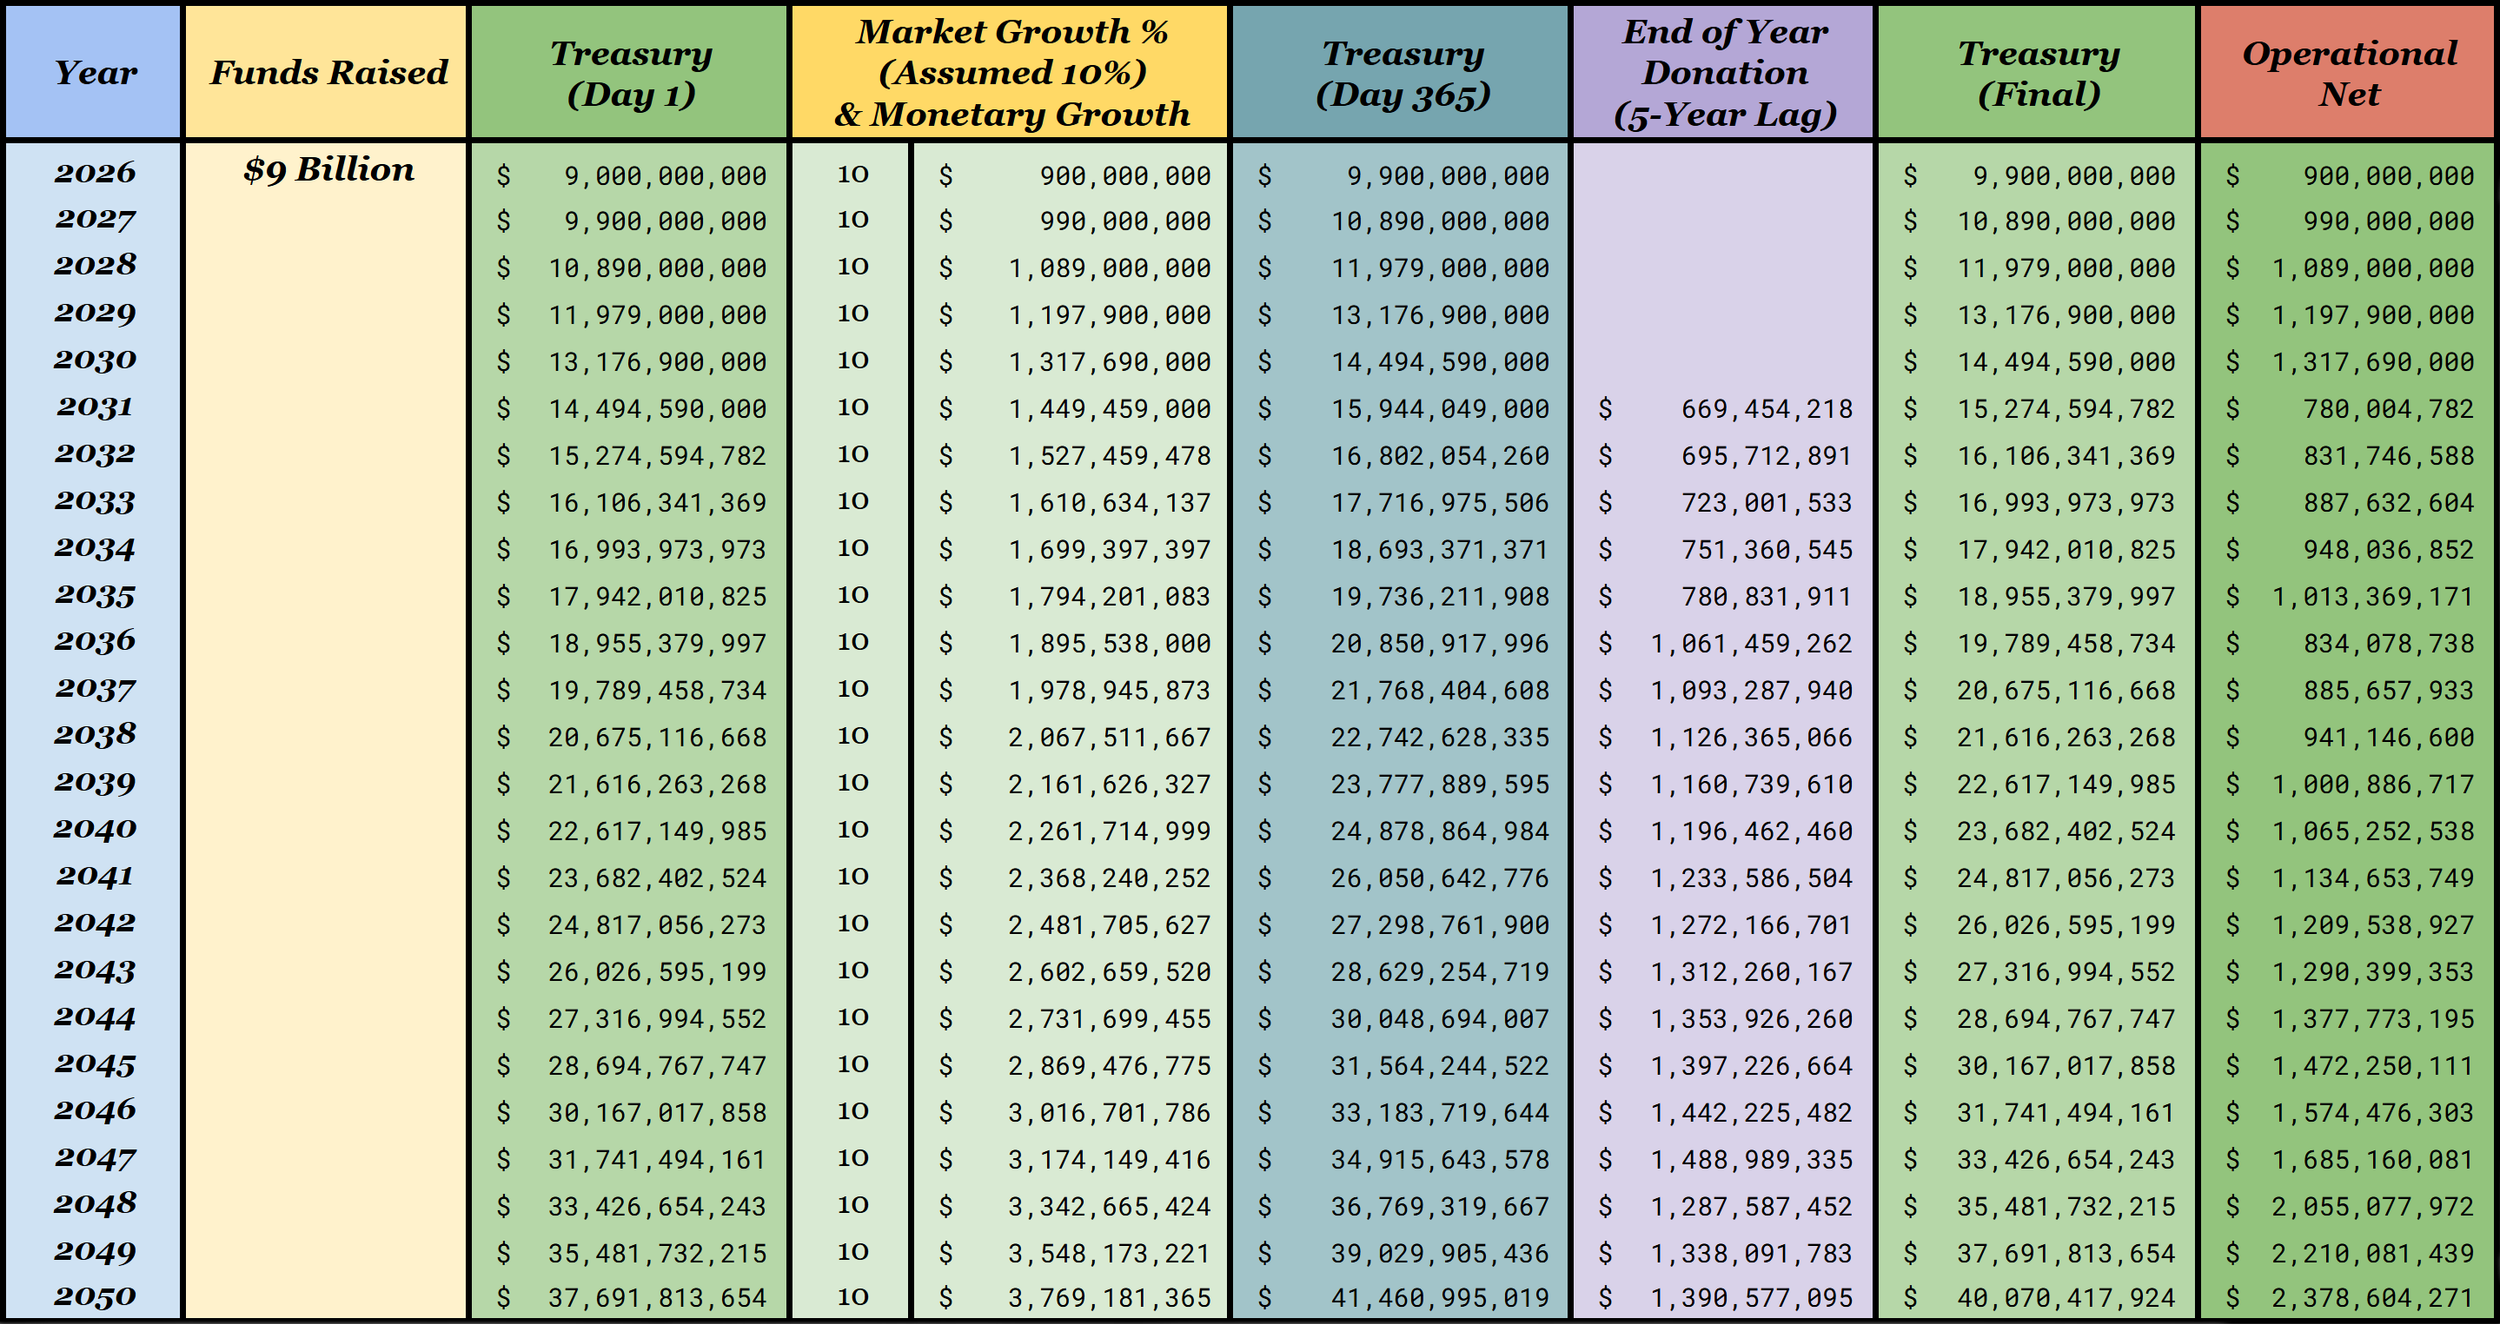
In an ideal world, $9 billion would appear in my bank account, I’d hire a team to invest it for me, the stock market would rise its average 10% every year in a controlled manner, and I’d pay for childhood cancer treatment myself. This super realistic situation, identical to the above sheets with real numbers, is illustrated here:
The Costs of Treatment
We do not live in that ideal world, so let’s take a step back and breakdown a few more ideas.
First let’s talk about the structuring of donations. As you may have noticed, they did not begin until the year 2031, skipping the first 5 years. This is shown in the far right column, which are the values of End of Year Donation (5-Year Lag) from the previous spreadsheet.
Before explaining that gap, let’s orient ourselves with this sheet. The predicted increase in diagnoses (due to population growth, 0.7%) and predicted increase of treatment costs (due to inflation, 3.2%) for each year are shown in Children Diagnosed and Average Cost of Treatment, respectively. Multiplied together, they produce Total Annual Costs each year.
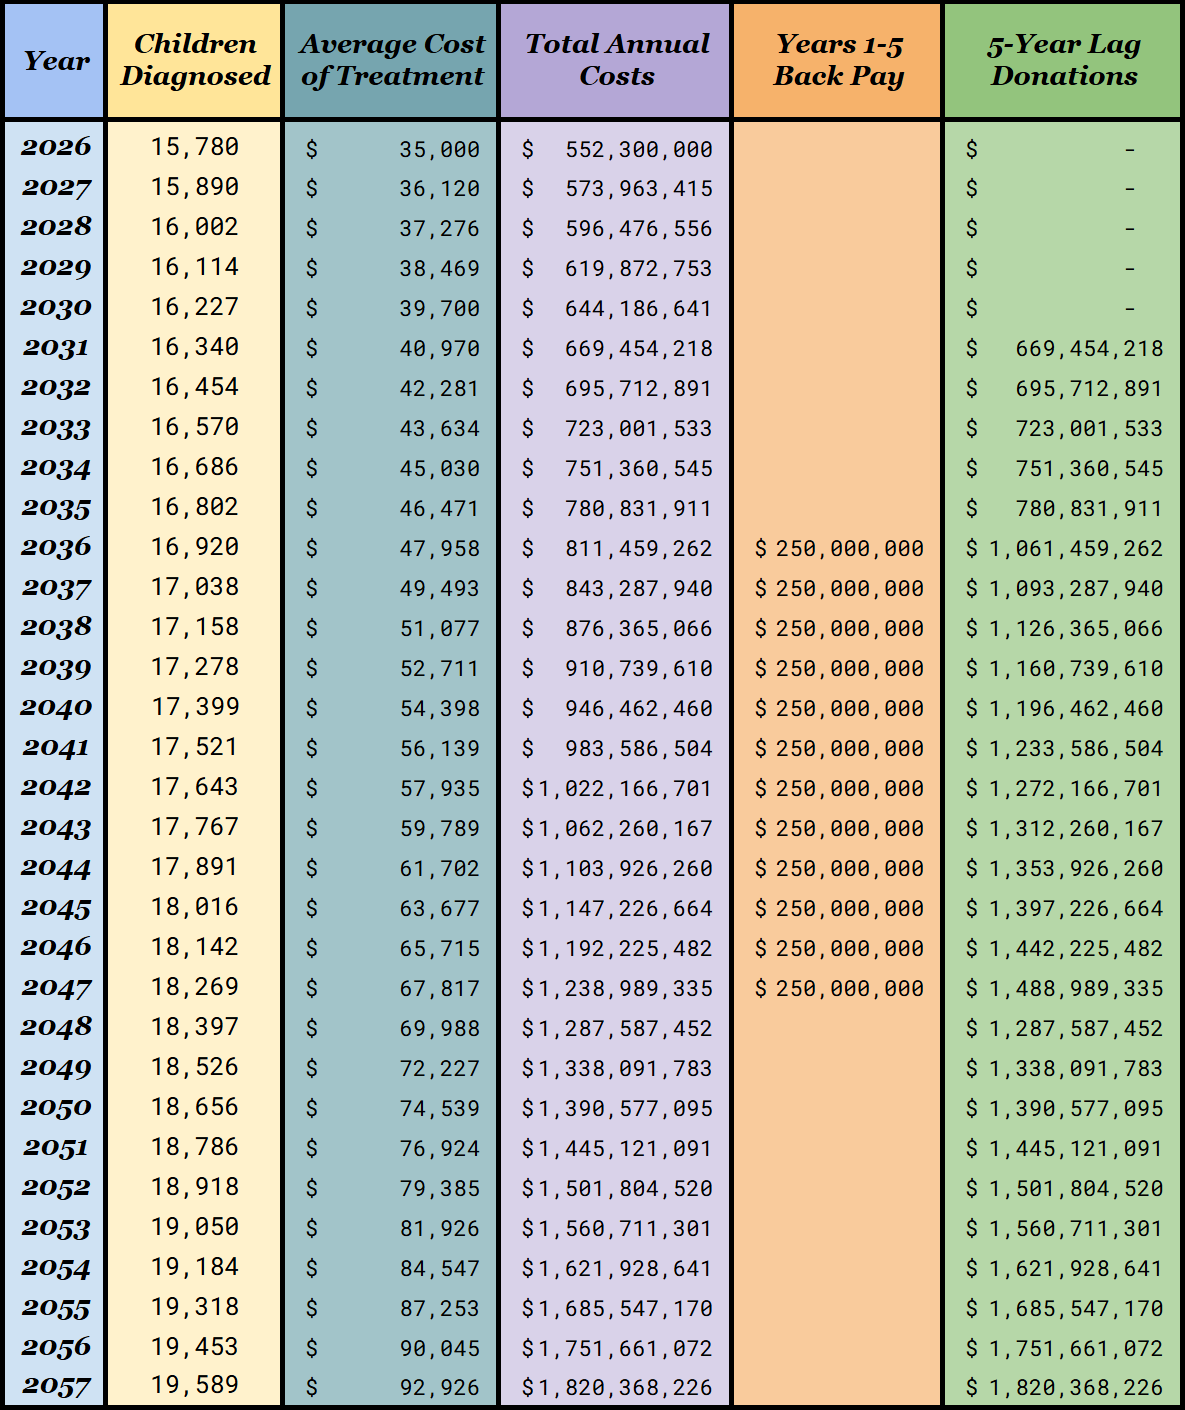
For reasons discussed momentarily, we would back pay families from the first 5 years (an estimated $2.96 billion), in Years 2036-2047 at $250 million per year. When Years 1-5 Back Pay is summed with Total Annual Costs, we arrive at 5-Year Lag Donations (or our “End of Year Donations (5-Year Lag)” for any sheet that has donations missing for the first 5 years). So, why is it structured as such?
That answer lies with the nature of the stock market, as well as a means of reducing the scale of the initial principle (trying to be as conservative with expectations as possible). The stock market, as we all know, isn’t all sunshine and rainbows. There are years of declines, hardships, and collapse well documented throughout U.S. history. Although it averages 10-11% each year, there are years slightly or greatly above, and years very well below that average. The idea of skipping years would allow for robustness to this unknown variable. If Cheese Bank began investing during a negative year of the stock market, as well as donated half a billion dollars in said year, we could potentially fall well below the principle (aka values in Cheese Bank “Treasury (Day 1)”) needed to sustain exponential growth even if following years are positive (such as in “Example - $1.00”). Staying well in front of this curve is the key to success. Literally, the only one. How would our $9 billion hold up with said volatility with Year 1 versus Year 6 donations?
Historical Growth Statistics
This spreadsheet factors historical data into the Market Growth column, which is no longer an assumed 10%, but rather that past year's actual value. For example, in 1977, historical data says the market dropped by 11.5 percent, our new value in the Market Growth column. In this model, End of Year Donations are every value in Total Annual Costs from Pediatric Treatment Costs (aka excluding the Back Pay column while donating Years 1-5).
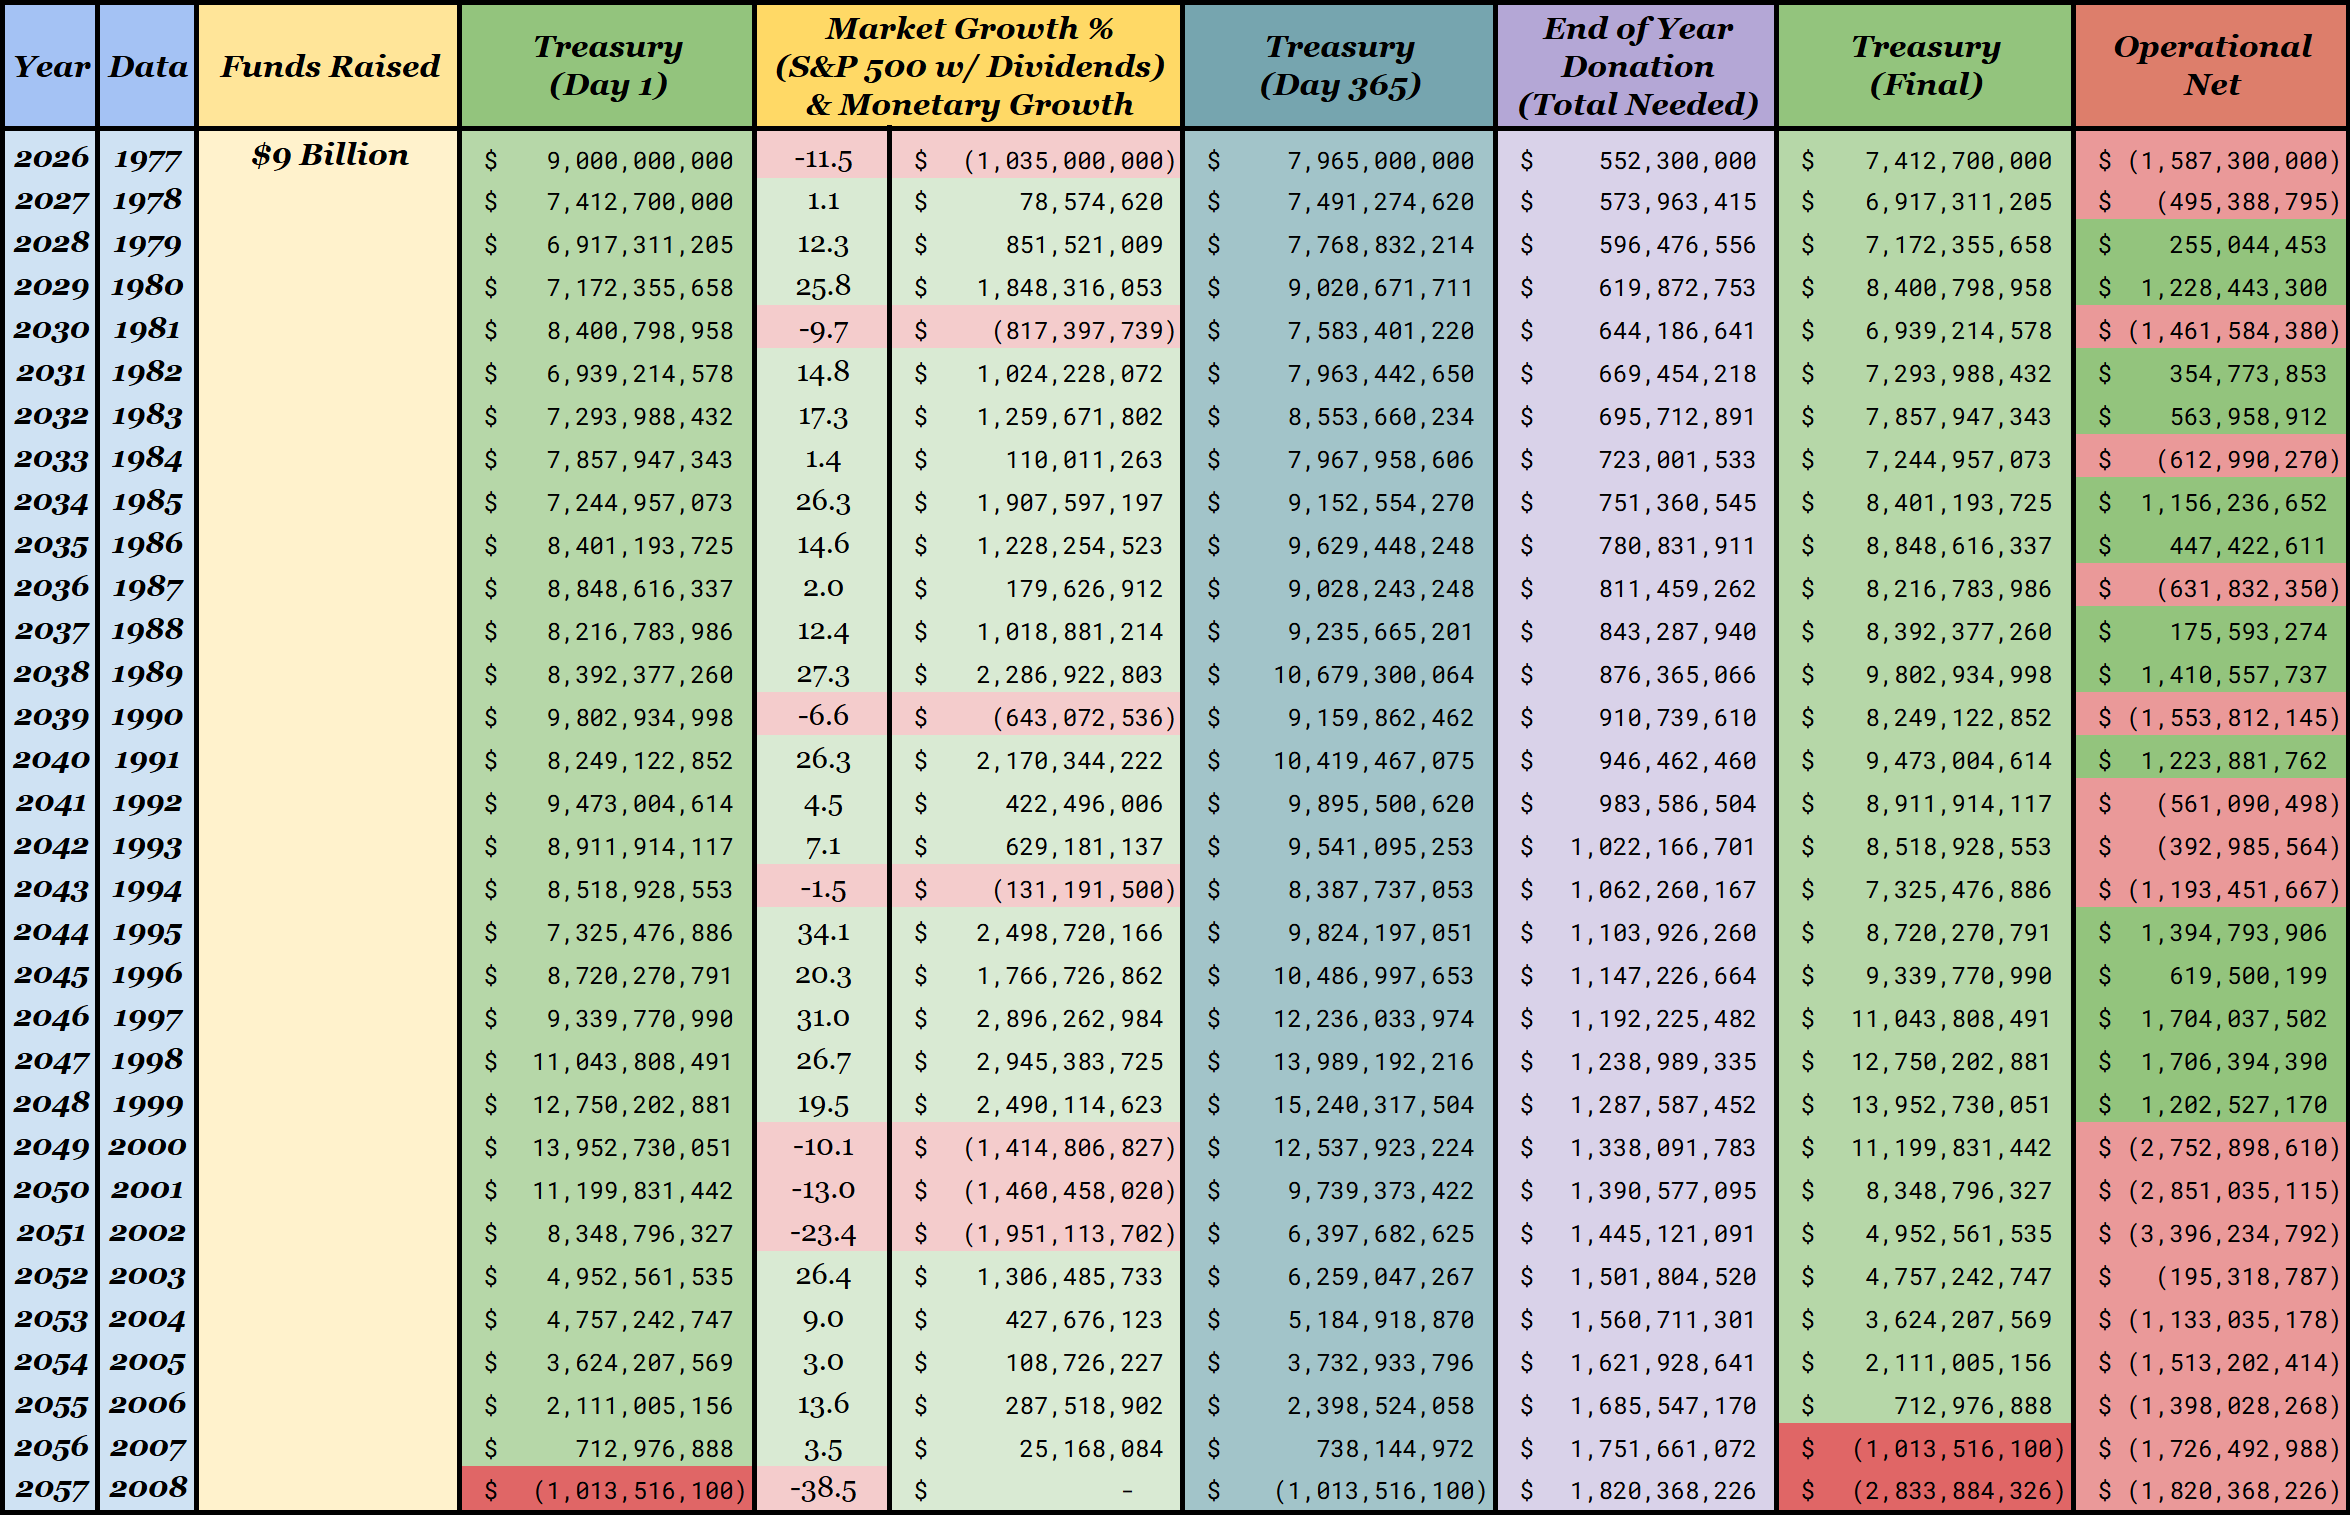
As we can see by the red values in Treasury (Final), the treasury is dry by the year 2056/2007. Does our 5-year donation lag prevent collapse?
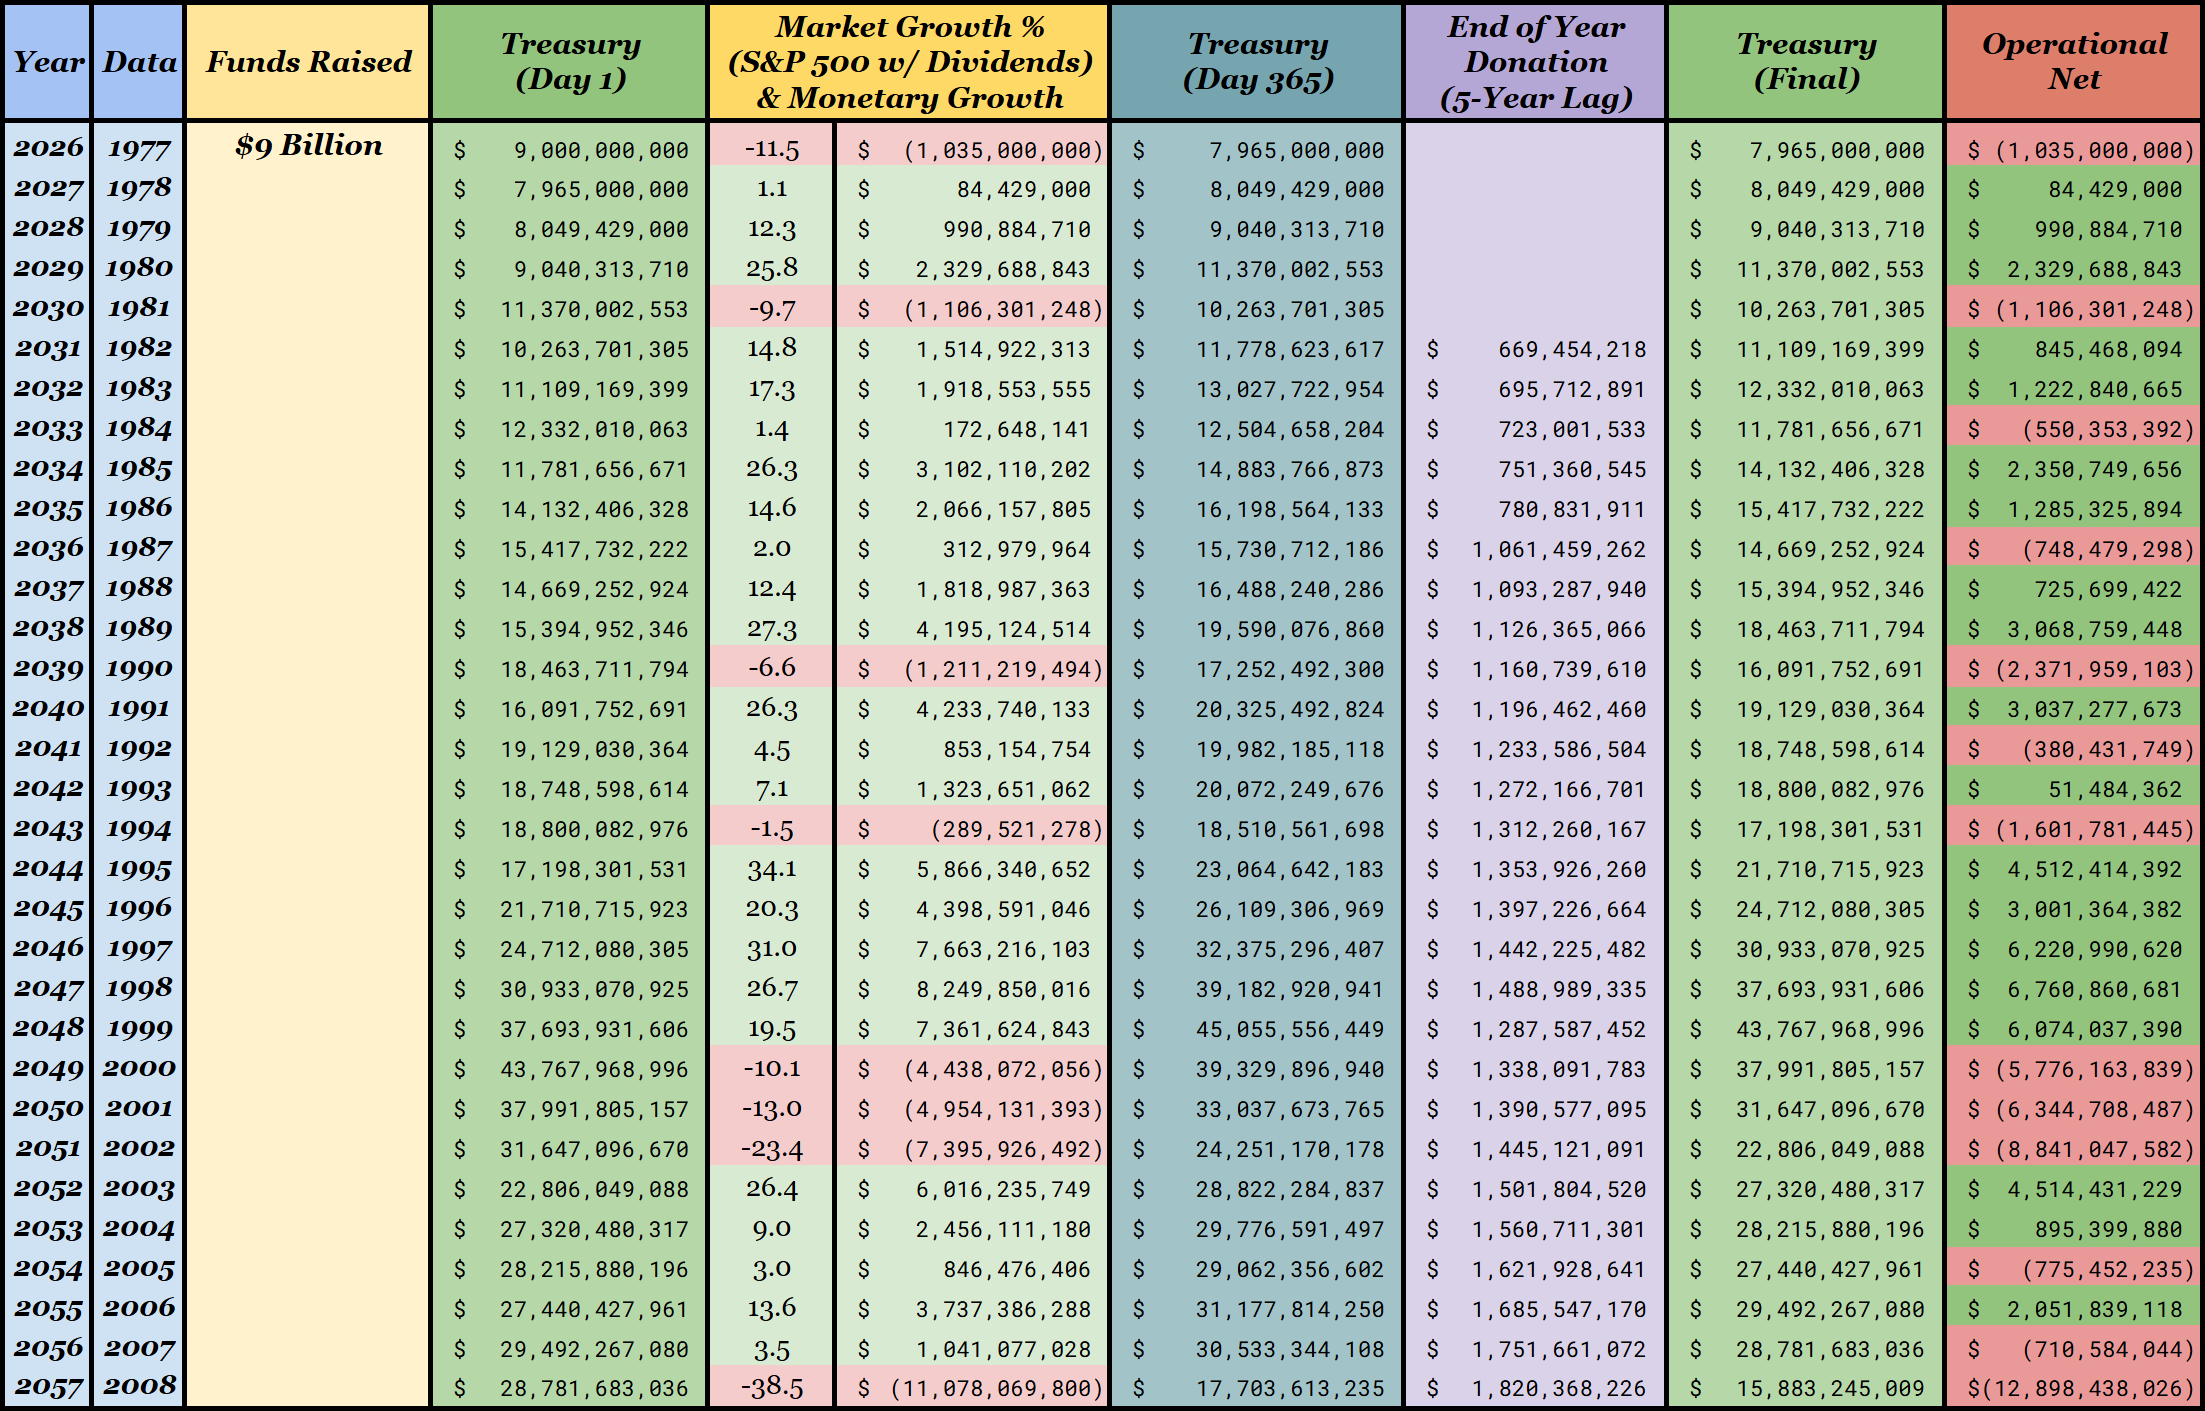
By including the 5-year gap in donations, which is paid back in years 11-22, it appears we can protect from stock market volatility by not making a bad year detrimental to Cheese Bank during its most vulnerable time. Additionally, it aims to jumpstart our exponential growth, as ideally we would have large positive years causing a substantial surge in funds with minimal spending in the first years of Cheese Bank.
This is not shown in any sheets, but if we were to start during a 5-year positive run, such as 1982-1986, we could turn our $9 billion into $12 billion before any donations began. Almost guaranteeing Cheese Bank’s success. In an even more ideal situation, we just have substantially more funding than $9 billion and this delay would not be needed.
In sum, we just pretended to start Cheese Bank in 1977 using the current value of the dollar and treatment costs. By using 1977’s reported stock market change and every year after, we were able to hypothesize the sum of money needed today to make Cheese Bank successful today. Arriving at the previously shown approximately $9 billion as the threshold of success. Additionally, it allowed for a first pass at strategizing the endowment’s approach to donation structure. I even played devil’s advocate, starting us on a negative year, with 2 of the 5 first years being negative, and yet it still survived with this donation structuring.
Doomsday Scenarios
Yet this 5-year lag does not guarantee success. What if we started during the Dot-com Bubble? What about during the Housing Market Crash? What about just before the AI bubble pops? Here are a few “Doomsday” examples:
Dot-com Bubble
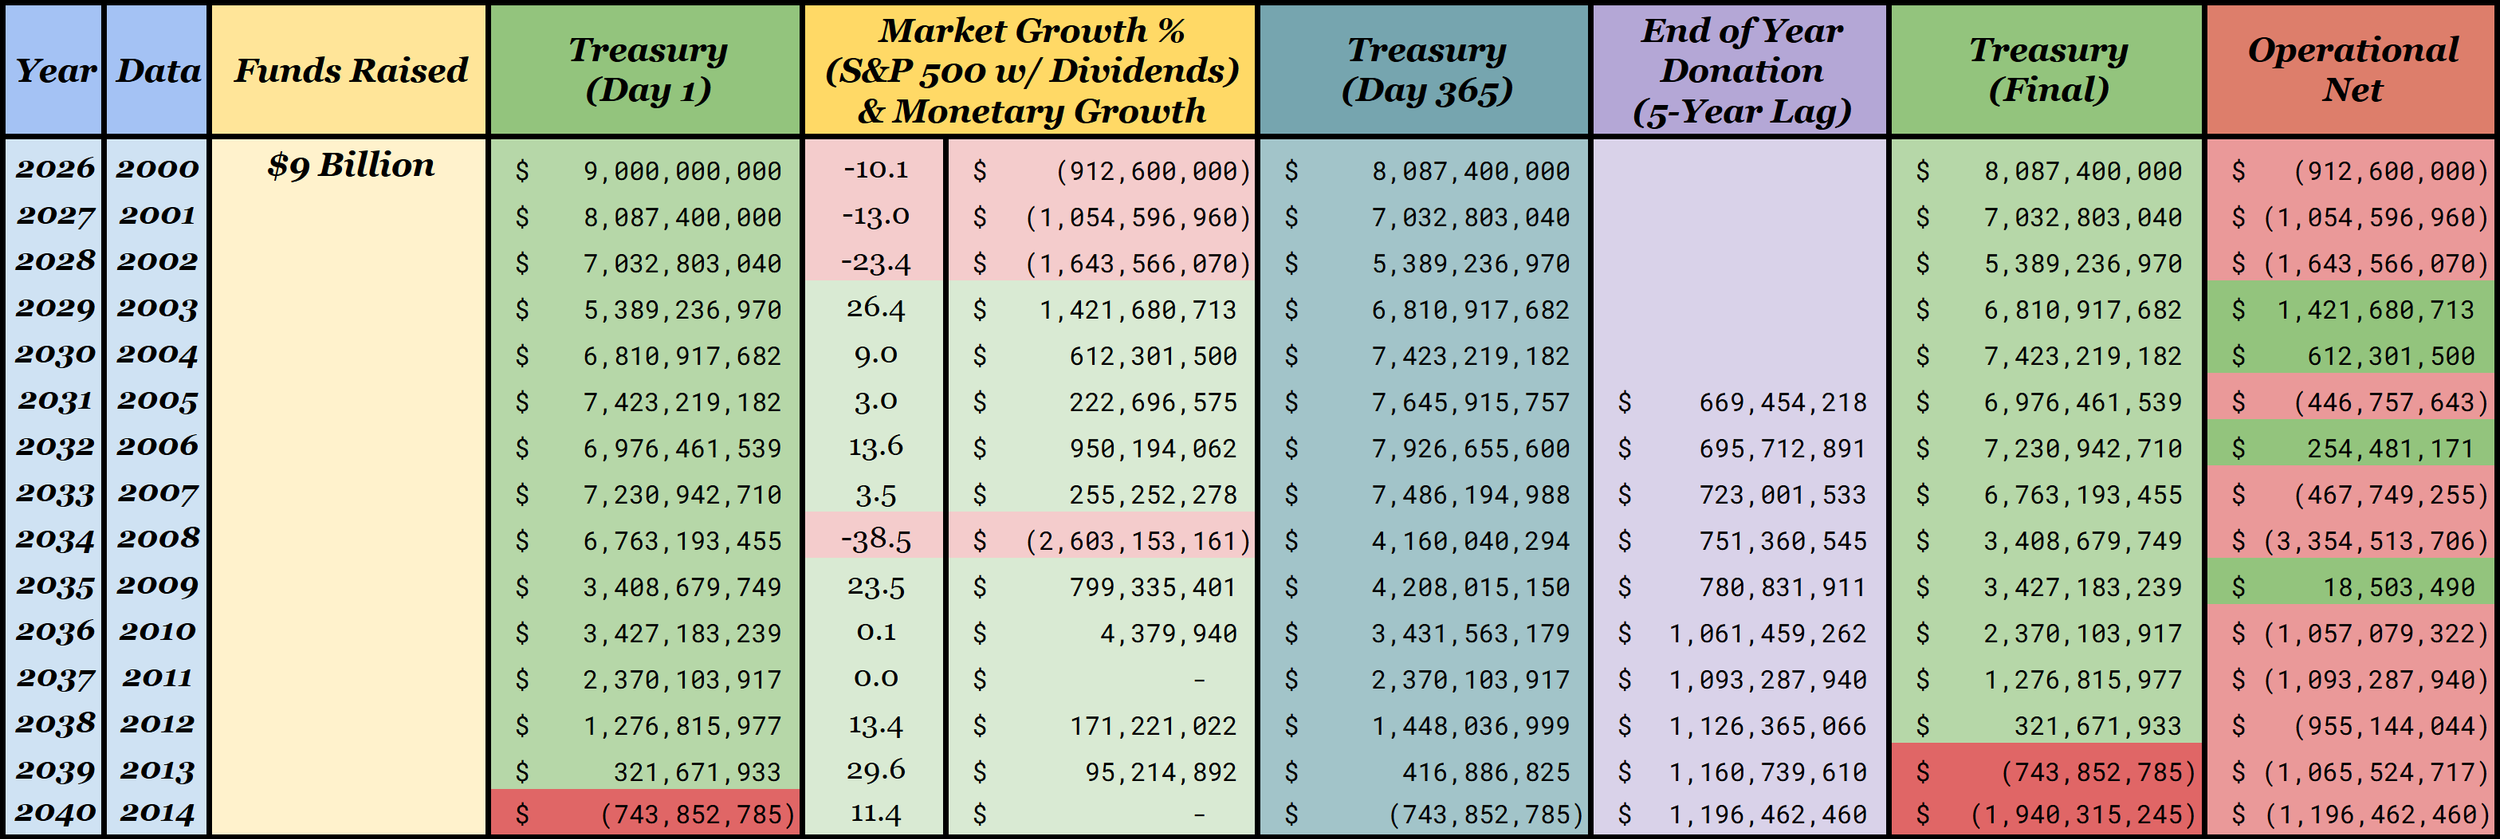
Even with the built in robustness, the Dot-com bubble would have been a non-feasible starting year. Notably in the next sheet, we would have survived the 2008 housing market crash if that was the year of Cheese Bank’s inception, although we would probably have needed a new pair of underwear.
Housing Market Crash
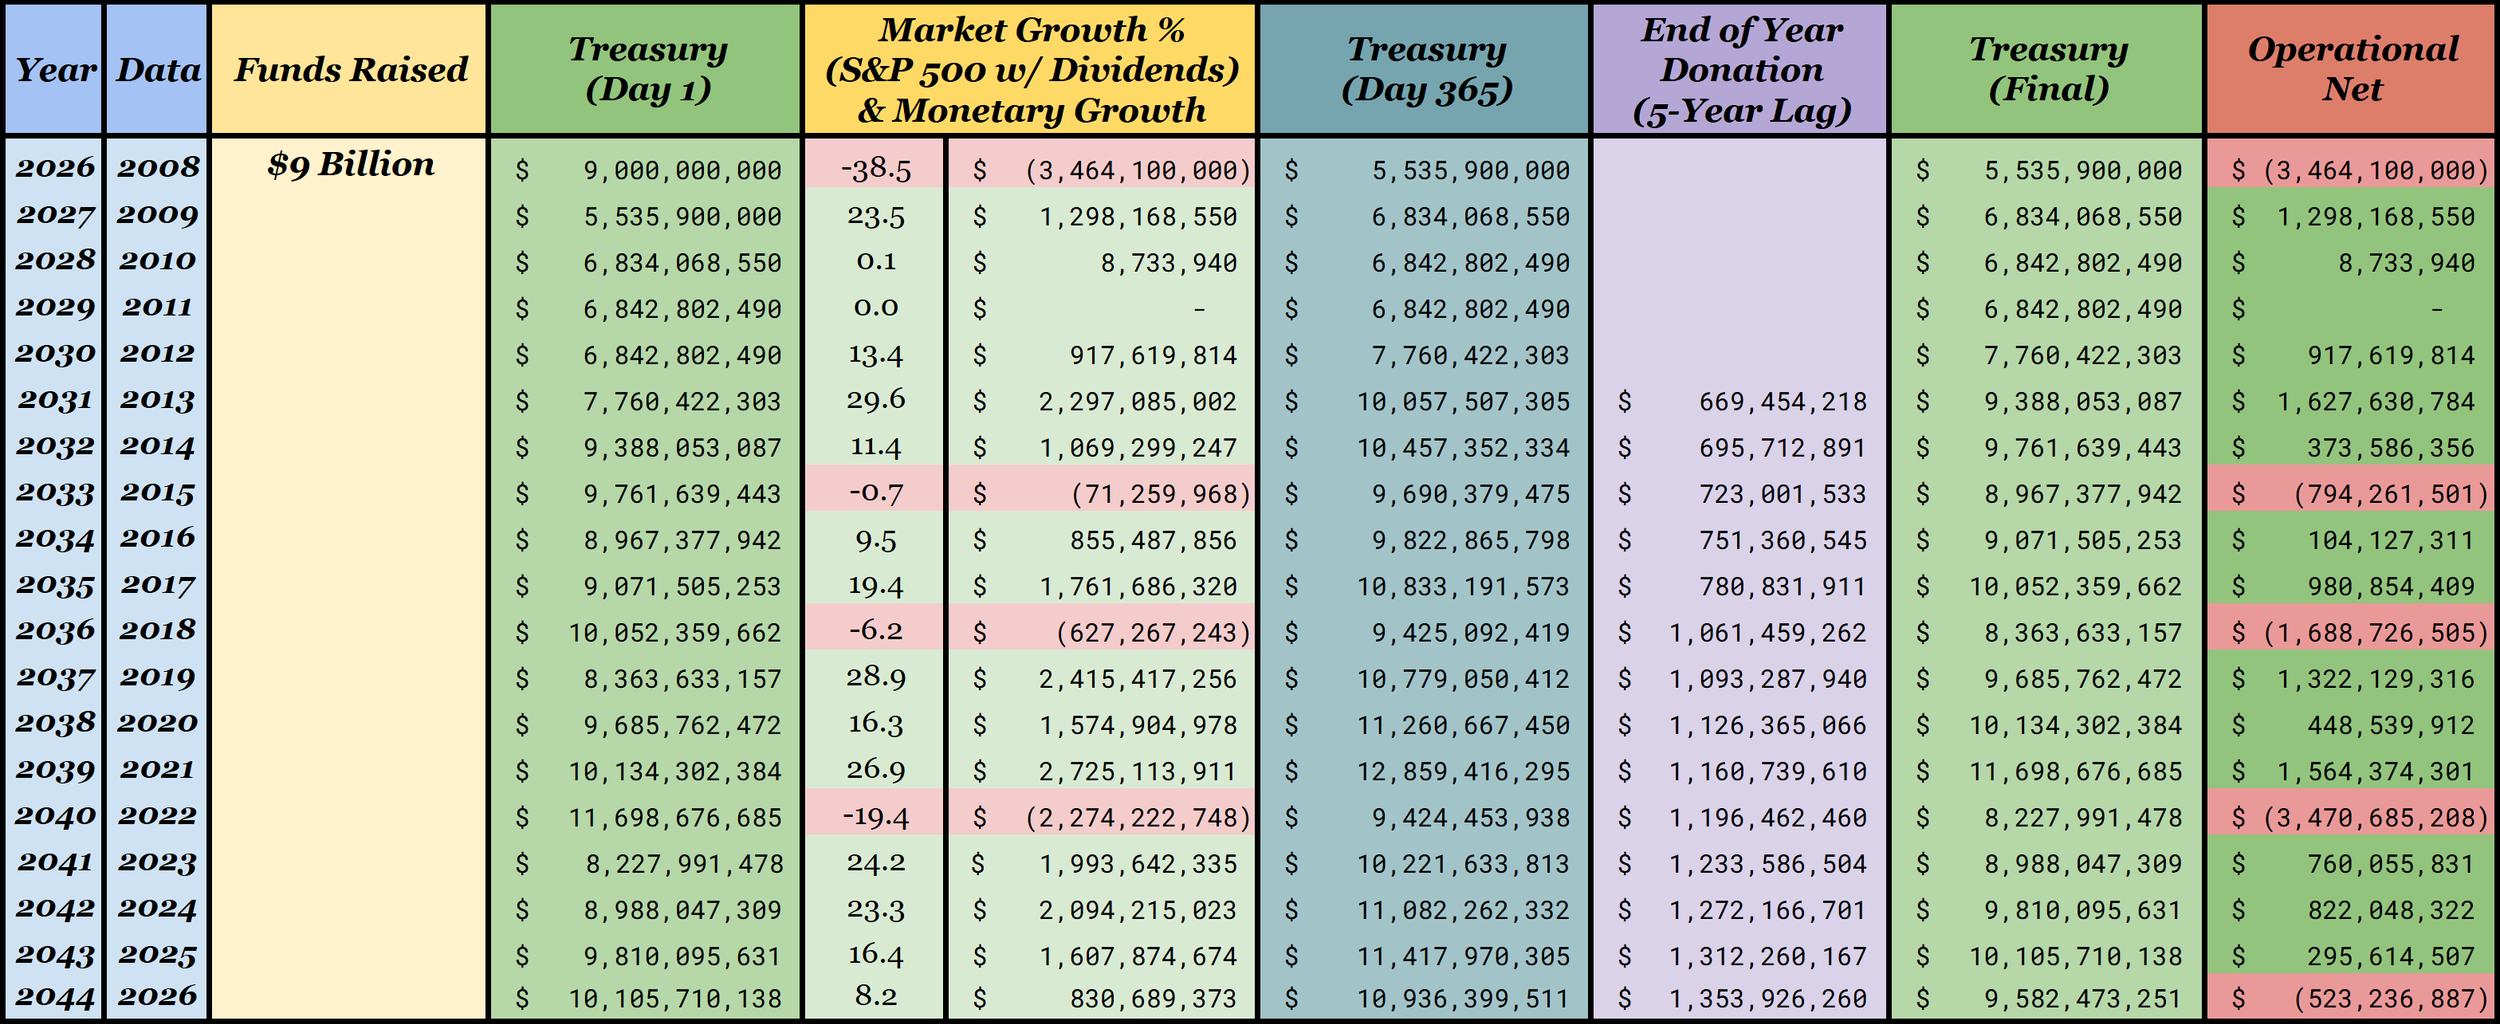
To drive home why I propose lagging donations, if we had started donating in year 1, aligning with the housing market collapse, Cheese Bank would have fallen in the short-term, as shown below.
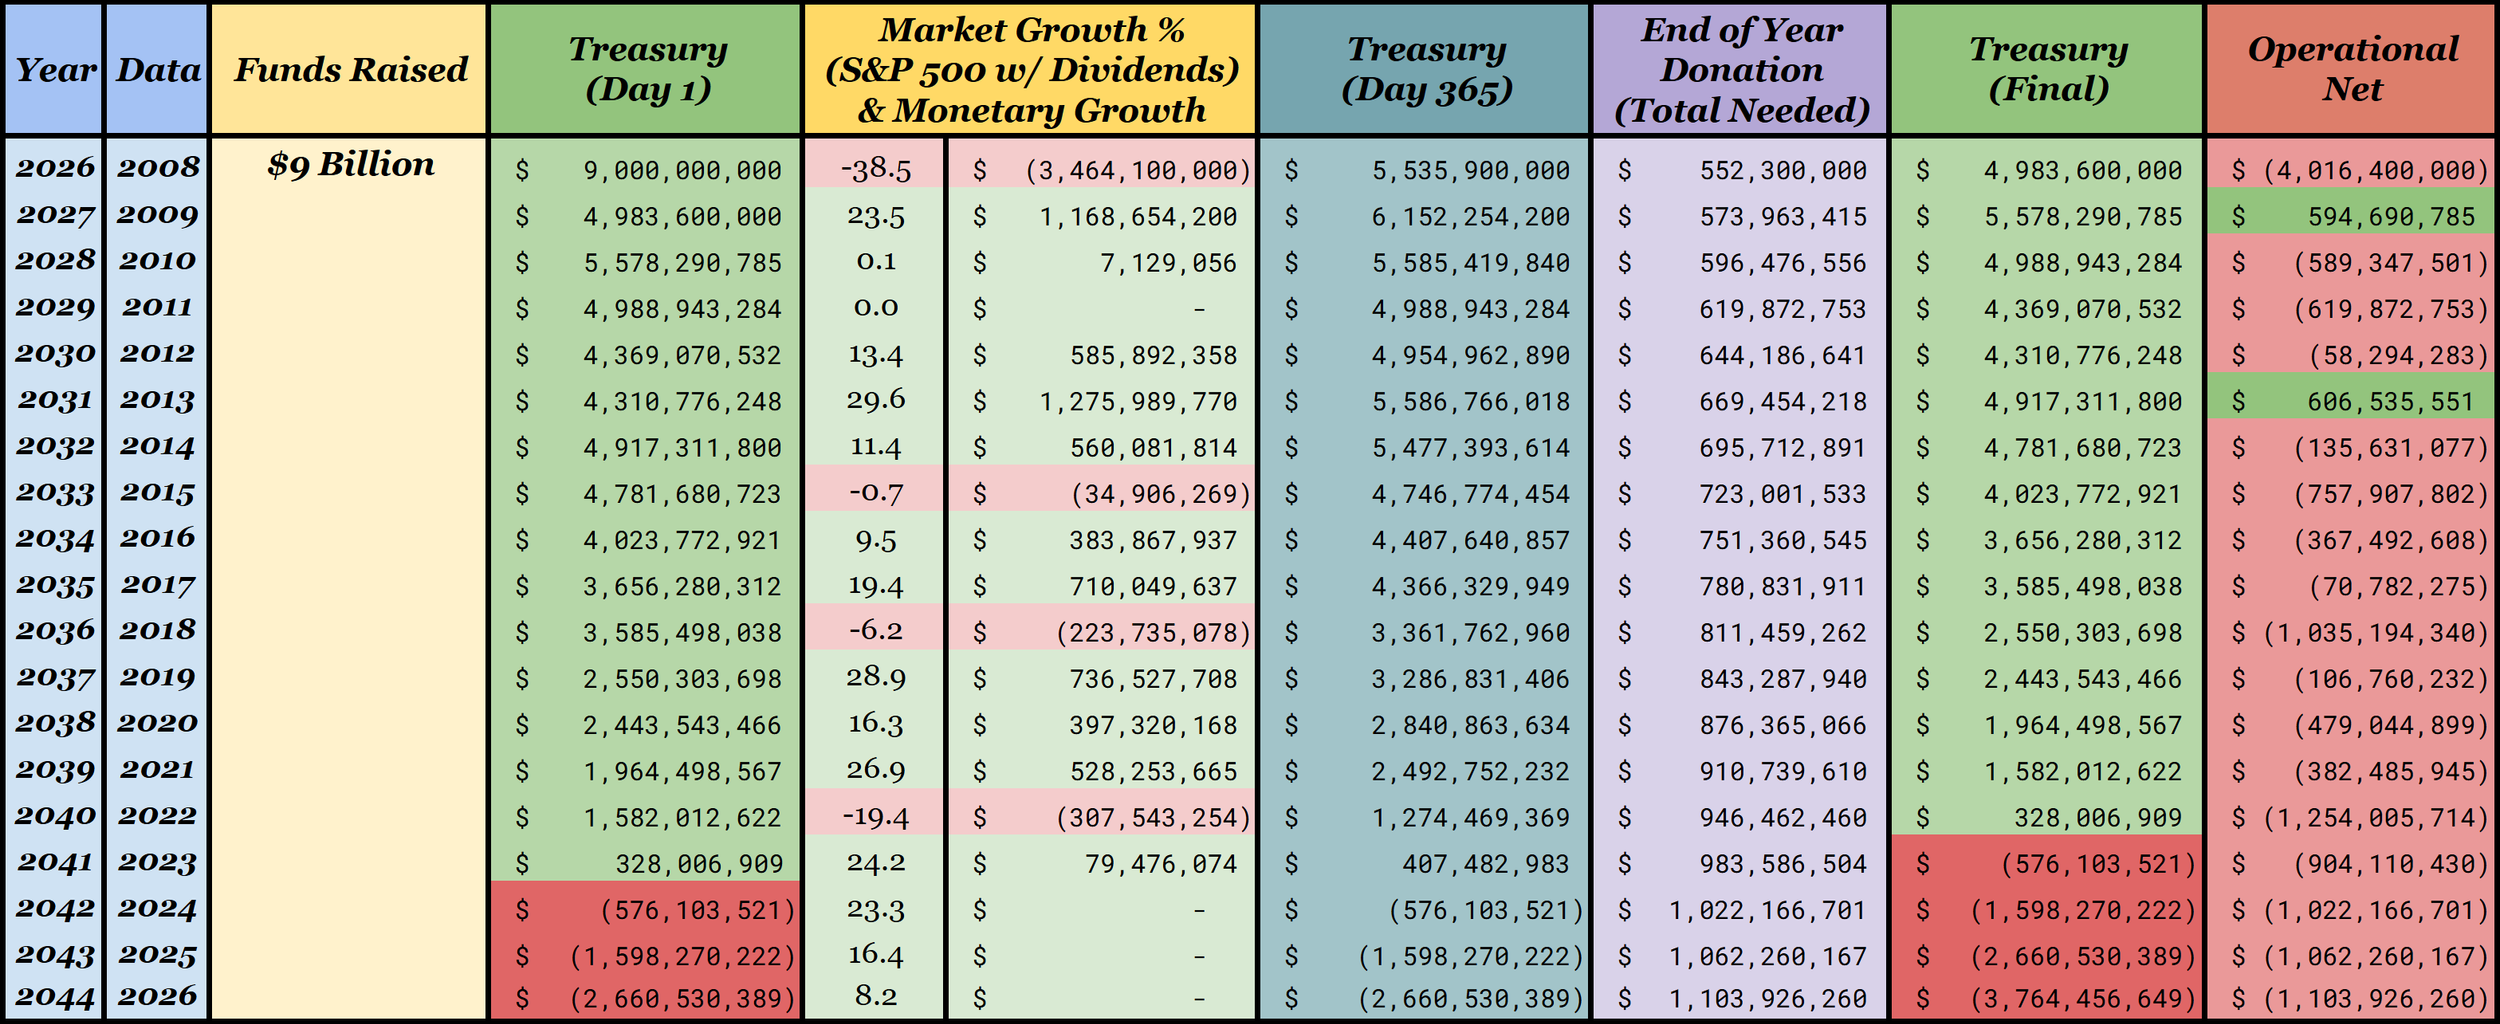
Housing Market Crash - No Donation Lag
Although $9 billion seems to be sufficient, whatever we could raise over that would widen our margins-of-error of success. What if that collapse were to be forecasted or inevitable for whatever reason?
Would we, as Cheese Bank, be a failure?
It is Impossible to Fail
Even if the stars aligned against us as much as they possibly could, such as starting a multi-year stretch such as those illustrated in the Dot-com Bubble spreadsheet, we still would have donated over $7.5 billion to childhood cancer treatment (the sum of End of Year Donation from 2026-2039).
What is our risk-reward analysis? We lost $1.5 billion on a gamble that would have paid for all pediatric cancer treatment forever, while still donating $7.5 billion over the course of 13 years.
Importantly to note, every dollar that enters the Treasury would one day be donated to pediatric cancer, which will nearly always be more than our starting value. So even if we failed after 20 years, we are statistically likely to have donated well over our initial starting amount.
Let’s take one final look at the spreadsheet below:
Using historical data, by year 31 of operation, this is what we would have accomplished:
Funds Raised:
$9,000,000,000
Remaining Treasury:
$15,883,245,009
Donated by 2057:
$34,162,454,899
The Conclusion
Everything points to this being possible. If we could amass $9 billion, we could pay for all pediatric cancer treatment for the foreseeable future! Even if we did fail somewhere in there, every cent would be donated either way. And raising and donating $9 billion is far from a failure in itself!
So what’s next? Well you understand the endgame of Cheese Bank. Click the button below to see what reality would likely actually hold for us: